Record performance
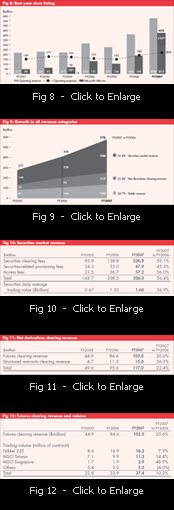
SGX Group saw its best year ever in FY2007. Net profit scaled to a new height of $421.8 million, more than double the previous year’s $187.6 million earnings
(Fig 8). Excluding the one-time gain from the disposal of SGX Centre and the write-back of its impairment allowance, net profit and return on equity hit all-time highs of $311.3 million and 37.5% respectively.
Operating revenue increased 41.4% to $576.2 million in FY2007 with record revenue across all revenue categories, namely securities market revenue,
net derivatives clearing revenue and stable revenue
(Fig 9). This stellar performance was driven by overall optimism in a buoyant economy supported by benign interest rates and strong liquidity.
SECURITIES MARKET REVENUE
Securities market revenue achieved a 56.4% gain to $326.0 million in FY2007 (FY2006: $208.5 million)
(Fig 10). Boosted by the strong rally in the securities market, daily average trading value grew 56.9% to $1.60 billion as compared to $1.02 billion in FY2006.
NET DERIVATIVES CLEARING REVENUE
Supported by higher futures and structured warrants clearing revenues, net derivatives clearing revenue grew 22.4% to $117.0 million in FY2007 (FY2006: $95.6 million) (Fig 11).
Futures clearing revenue in FY2007 gained another
20.6% on the back of a 88.5% growth in FY2006 upon
the successful e-migration of our futures contracts. This was despite challenges in building our fixed income suite and the expiration of the Globex revenue sharing arrangement with CME in February 2007.
|

|
Our Asian Equity Derivatives contracts performed well with volumes for the Nikkei 225 and MSCI Taiwan futures contracts growing 7.9% and 14.4% respectively (Fig 12). Similarly, our MSCI Singapore futures contracts also registered strong growth, with volumes soaring 48.9% to 2.9 million contracts from last year’s 1.9 million contracts.
The structured warrants market experienced high activity with a 62.2% hike in new issues. This, together with the buoyant securities market, contributed to a 49.3% growth in trading value (Fig 13). Consequently, our structured warrants clearing revenue gained 36.3% to reach $15.0 million (FY2006: $11.0 million). |
 |
 |
 |
STABLE REVENUE
 Robust market activities and increased demand for Robust market activities and increased demand for
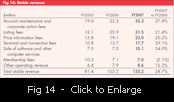
our services provided the impetus for further growth in our stable revenue. Stable revenue grew 28.7% to $133.2 million (FY2006: $103.5 million), mainly driven by three key contributors: account maintenance and corporate action fees, listing fees, and price information fees (Fig 14).
Account maintenance and corporate action fees rose 57.8% to $35.3 million as a result of increased dividend processing and other corporate action activities.
The number of listed companies in our securities market grew from 691 to 722 in FY2007. Coupled with the cessation of transitional rebates granted, listing fees increased 21.4% to $31.5 million.
We continued to expand our distribution channels for SecuritiesBook and derivatives datafeed, seeing more subscriptions in the process. This, together with the restructuring of our derivatives datafeed fee schedule in line with international standards, generated $23.0 million in price information fees, up 20.2% from the previous year.
OPERATING EXPENSES
 Operating expenses grew at a slower pace than operating revenue and amounted to $211.1 million as compared with $183.7 million last year (Fig 15). The increase was mainly due to higher variable costs, namely higher variable bonus provision on the back of better performance and the cost of processing and royalties which rose in tandem with market activity. Operating expenses grew at a slower pace than operating revenue and amounted to $211.1 million as compared with $183.7 million last year (Fig 15). The increase was mainly due to higher variable costs, namely higher variable bonus provision on the back of better performance and the cost of processing and royalties which rose in tandem with market activity.
Operating expenses excluding variable costs, remained fairly well controlled. Two major contributors to non-variable operating expenses were staff costs and system maintenance and rental costs.
Staff costs (excluding variable bonus) rose 20.2% in FY2007. This was mainly contributed by the expenses arising from the new performance share plan and long-term incentive scheme which were designed to retain our talent pool.
Technology remained an area of strategic focus, with resources invested to enhance technological capabilities. Our data centre outsourcing that began in February 2006 was the main contributor to the 16.9% increase in system maintenance and rental costs in FY2007.
OTHER GAINS
Other gains in FY2007 totalled $127.7 million. This included a $110.5 million gain with respect to the SGX Centre: $45.0 million from the write-back of allowance for impairment and $65.5 million from its disposal.
OPERATING LEVERAGE
 Continued growth in net derivatives clearing and stable Continued growth in net derivatives clearing and stable
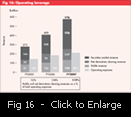
revenue together with prudent expense management resulted in improved operating leverage. In FY2007, net derivatives clearing and stable revenue covered 118.6% of our total expenditure, eclipsing the previous high of 108.4% in FY2006 (Fig 16). This was the second consecutive year the coverage crossed the 100% mark.
SHAREHOLDER RETURNS
 Return on equity (excluding the write-back of allowance for impairment and gain on disposal of SGX Centre) reached an all-time high of 37.5% compared with 32.0% in the preceding year. In view of our strong performance, the Board of Directors proposed a final dividend of 30.0 cents per share, bringing the total dividend for FY2007 to 36.0 cents per share Return on equity (excluding the write-back of allowance for impairment and gain on disposal of SGX Centre) reached an all-time high of 37.5% compared with 32.0% in the preceding year. In view of our strong performance, the Board of Directors proposed a final dividend of 30.0 cents per share, bringing the total dividend for FY2007 to 36.0 cents per share
(Fig 17). This represents a 90% payout of the current year’s profit and a dividend yield of 3.7%. Our dividend yield exceeded the average dividend yield of both our Mainboard listed companies (2.5%) and peer exchanges (2.6%).
Arising from the assessment of the likely sustainable earnings of the Group, the board is pleased to raise the annual base dividend from 8.0 cents to 12.0 cents per share with effect from FY2008.
SGX shares closed at $9.80 on 29 June 2007, a significant improvement from its previous close of $3.52 a year ago. Total shareholder return (TSR) over the past one year was 184.2%, outperforming the STI TSR of 49.7%.
CASH FLOW
As at 30 June 2007, the Group had cash and cash equivalents of $523.7 million, compared to $156.0 million a year ago. The improvement was mainly due to our strong operating performance and the disposal of our interest in SGX Centre.
Net operating cash flow increased to $354.6 million due to our higher operating profits (FY2006: $227.2 million).
Our investing activities recorded a net inflow of $204.1 million. Net proceeds of $266.3 million were received from the disposal of our interest in SGX Centre and $19.9 million from the partial redemption of our hedge fund portfolio. We also invested $75.8 million for a 5% stake in the Bombay Stock Exchange.
There was a higher net outflow of $191.1 million in our financing activities as compared to FY2006. A total of $186.2 million was paid out in dividends to SGX shareholders. Under the Share Purchase mandate, 4.06 million shares, totalling $18.6 million, were purchased for our Performance Share Plan. $17.5 million was received from employees who exercised their share options under the SGX Share Option Plan in FY2007.
CAPITAL STRUCTURE AND MANAGEMENT
The Group has been 100% equity financed (zero debt) since listing in 2000. Shares purchased for our Performance Share Plan during the year were held as treasury shares. As at 30 June 2007, there were 10.3 million outstanding share options. As part of our capital management, we disposed of our interest in SGX Centre to improve the efficiency of our balance sheet.
Our cash reserves were mainly deposited with major financial institutions. About $139 million were invested in a diversified portfolio of externally managed funds. On 27 July 2007, SGX decided to liquidate these funds as these had reached the end of their three-year investment mandate.
FINANCIAL RISK AND MANAGEMENT
Our primary foreign exchange exposure arises from our derivatives business and the externally managed funds. We hedge our foreign currency income where necessary and convert them to Singapore dollars regularly. Our foreign currency exposure with regard to our externally managed funds is fully hedged.
As at 30 June 2007, our contingent liabilities to banks amounted to US$185 million. These unsecured standby letters of credit were issued to the Chicago Mercantile Exchange as margins for our derivatives business and were backed by margin deposits received from member companies. We have put in place $570 million of committed standby bank credit facilities for prudent risk management and emergency funding needs. The facilities comprised of $370 million in unsecured credit lines and $200 million in share financing lines.
The Group provides the following in support of the CDP and SGX-DC Clearing Funds: an unsecured standby credit line of $75 million and cash resources of $25 million to the CDP Clearing Fund in accordance with CDP’s Clearing Rules; a financial guarantee and cash resources totalling $90 million to be utilised in accordance with SGX-DC’s Clearing Rules; and default insurance policies to support both the CDP and SGX-DC Clearing Funds. To cater to the growing derivatives market, the Group is also augmenting the SGX-DC Clearing Fund through additional default insurance, guarantees and cash resources.
We continue to review our insurable risks to ensure optimal coverage. We have insurance policies to cover major business areas including Industrial All Risks, Computer Insurance, Professional Indemnity and Comprehensive Crime Insurance, as well as a cover on terrorism.
ACCOUNTING POLICIES
The Group’s financial statements have been prepared in accordance with the Singapore Financial Reporting Standards (FRS) issued by the Council on Corporate Disclosure and Governance. The same accounting policies and methods of computation as in the FY2006 audited financial statements have been applied for the current reporting period except for the adoption of new FRS and Interpretations to FRS (INT FRS) that are required for the current reporting period.
FRS 19 (Amendment) – Employee Benefits
FRS 21 (Amendment) – The Effects of Changes in Foreign Exchange Rates
FRS 32 (Amendment) – Financial Instruments : Disclosure and Presentation
FRS 39 (Amendment) – Financial Instruments : Recognition and Measurement
INT FRS 104 – Determining whether an Arrangement contains a Lease
The adoption of the above FRS and INT FRS did not result in substantial changes to the financial statements for the year.
|

